Provides access to members that control the drawing of chart symbols (pie, bar, stacked bar) on a map to represent features.
Product Availability
Description
This interface provides access to members that control chart renderering of features.
Members
| Description | ||
|---|---|---|
 |
BaseSymbol | Background fill symbol, (used when chart symbols are drawn for polygon features). |
|
ChartSymbol | Chart symbol object. |
 |
ColorScheme | Color scheme (user interface property only). |
 |
CreateLegend | Creates the legend. Call after all properties are set. |
|
FieldTotal | Field total for the field at the specified index. |
|
Label | Chart label. |
|
UseOverposter | Indicates if the overposter is used for positioning the chart symbols. |
CoClasses that implement IChartRenderer
| CoClasses and Classes | Description |
|---|---|
| ChartRenderer | A chart renderer used to draw pie, bar, and stacked bar chart symbols. |
Remarks
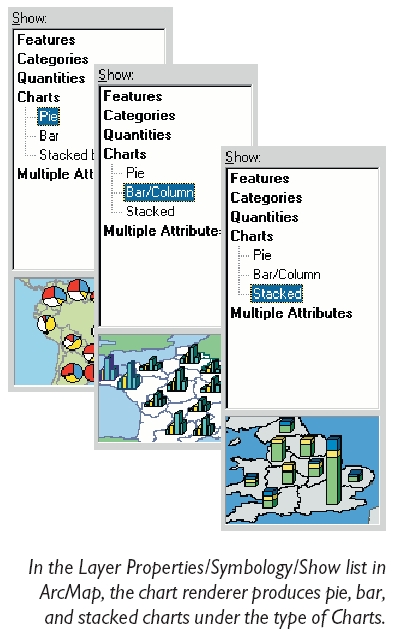
The ChartRenderer requires a list of fields whose values are used to generate the pie slices, individual bars/columns, and stacked chart slices for each feature. Assign fields using IRendererFields. The chart type (pie, bar/column, or stacked bar/column) depends on the symbol assigned to ChartSymbol.
Set other properties for a ChartRenderer using this interface. Additionally, set properties for the chart symbol via IChartSymbol and also through interfaces specific to the chart symbol coclasses: PieChartSymbol, BarChartSymbol, and StackedChartSymbol. Also, use IPieChartRenderer to set properties specific to rendering with pie charts.