As an ArcGIS user, I am an avid explorer and have frequently referenced paper maps to seek out new adventures. Eventually, my desire to document my adventures by creating my own maps led me into GIS. I have created many maps that document my hiking and mountain biking adventures using topographic information from USGS but, until recently, I never worked with bathymetry information.

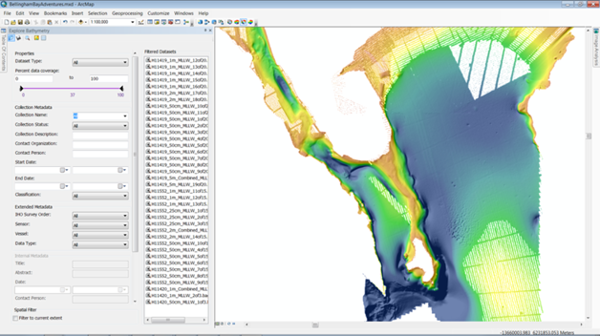
I was introduced to bathymetry when I decided to make a map of Bellingham Bay. As a resident of Bellingham, WA, the bay was always a part of my life. I had many adventures in the bay, from kayaking to a secluded island to sailing out to the San Juan Islands. My goal was to document these adventures using a detailed map of the bay depth as a backdrop. I found free, detailed bathymetry data for Bellingham Bay from the NOAA National Geophysical Data Center. However, the available bathymetry data was a mix of different resolutions, sensors, and dates. Also, the volume of the available data was daunting. The bathymetric data available for Bellingham Bay was contained in 38 footprints and the size of the entire data set was approximately 6GB.
To sort through the data and generate a quality map of Bellingham Bay, I used ArcGIS for Maritime: Bathymetry. With ArcGIS for Maritime: Bathymetry, I was able to register all of the data into my bathymetric database, then preview, filter, and sort the bathymetry data all at once without any processing delays or long wait times. I work with imagery on a daily basis and am familiar with the difficulties of processing large raster files. Therefore, I was surprised at how easy it was to handle gigabytes of bathymetry data in ArcGIS for Maritime: Bathymetry. Now I feel like a professional at working with bathymetry and am looking forward to using ArcGIS for Maritime: Bathymetry to help map my future adventures in Alaska.
