


 Object Model
Syntax
| Visual Basic (Declaration) | |
|---|---|
Public Class FlareClusterer Inherits GraphicsClusterer Implements ILegendSupport | |
| C# | |
|---|---|
public class FlareClusterer : GraphicsClusterer, ILegendSupport | |
Remarks
General Remarks:
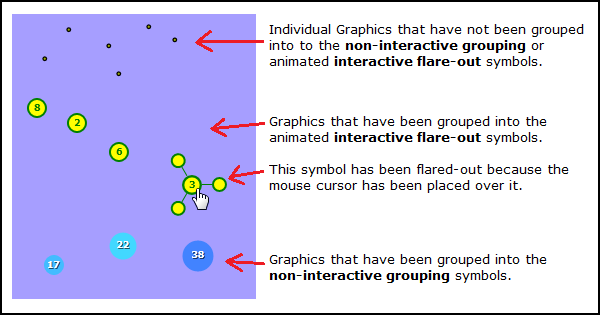
The FlareClusterer allows users to view geographic phenomena in a condensed form by clustering the number of occurrences of features into non-interactive grouping and animated interactive flare-out symbols. The FlareClusterer can be used on features in a FeatureLayer or GraphicsLayer. The following is a visual depiction of various style of graphics that can be displayed using the FlareClusterer:
Use the .Clusterer Property on the FeatureLayer or GraphicsLayer to set the FlareClusterer. Any type of specialty layer that is based upon (i.e. Inherits) a GraphicsLayer can use the FlareClusterer; this specifically includes: ESRI.ArcGIS.Client.Toolkit.DataSources.GpsLayer, ESRI.ArcGIS.Client.Toolkit.DataSources.CsvLayer, ESRI.ArcGIS.Client.Toolkit.DataSources.GeoRssLayer, and ESRI.ArcGIS.Client.Toolkit.DataSources.KmlLayer (that has a sub-layer that is based on a GraphicsLayer).
The FlareClusterer.FlareBackground changes the solid color of the flares in the animated interactive flare-out symbol. The default FlareClusterer.FlareBackground is Red.
The FlareClusterer.FlareForeground changes the outline color of the flares and the text in the animated interactive flare-out symbol. The default FlareClusterer.FlareForeground is White.
How the FlareClusterer works:
The FlareClusterer.MaximumFlareCount Property defines the maximum number of flares that can occur in the animated interactive flare-out symbol. The FlareClusterer.MaximumFlareCount also determines when the FlareClusterer switches from a non-interactive grouping symbol to an animated interactive flare-out symbol. The farther a user zooms-out in the Map the more individual graphic features will be compressed into a single non-interactive grouping symbol. Conversely, the father a user zooms-in on the Map the less non-interactive grouping symbols will display and the more animated interactive flare-out symbols will begin to appear. The default value for the FlareClusterer.MaximumFlareCount Property is 10 features.
The FlareClusterer.Radius Property defines how many pixels are between individual graphic features in FeatureLayer or GraphicsLayer before they convert to non-interactive grouping or animated interactive flare-out symbols. When the number of pixels between two graphic features is larger than the FlareClusterer.Radius Property then those two graphic features will be shown individually in the Map Control. The default value for the FlareClusterer.Radius Property is 20 pixels.
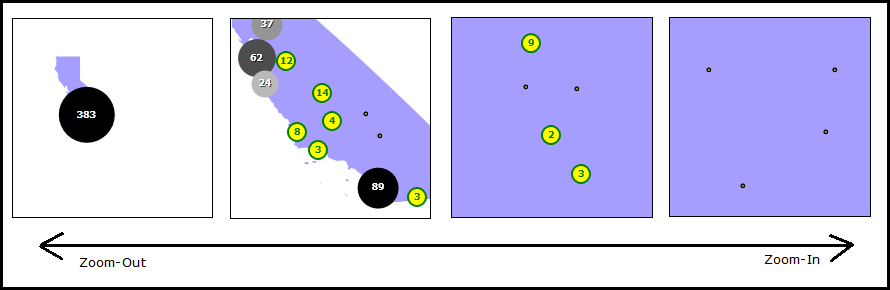
For example: assume that a FeatureLayer had 383 features. When zoomed-out to the FeatureLayer’s maximum extent a single non-interactive grouping symbol with the text '383' would display. As the user zooms-in, the number of FlareClusterer symbols would dynamically change to adjust to how many graphic features need to be grouped together. At some threshold during the zoom-in process, some of the graphics may switch from a non-interactive grouping symbol to an animated interactive flare-out symbol based upon the FlareClusterer.MaximumFlareCount setting. Additionally, anytime the pixel spacing between individual graphic features is larger than the FlareClusterer.Radius Property setting, individual graphic features will be drawn. At some point the user will zoom-in so far that only individual graphic features will display and the non-interactive grouping and the animated interactive flare-out symbols will not be necessary. The following diagram gives a visual depiction of how this works:
How the FlareClusterer.Gradient Property works:
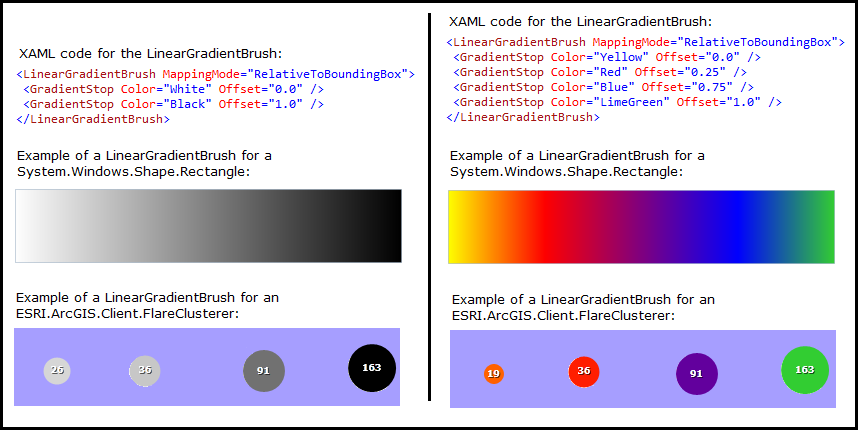
Use the FlareClusterer.Gradient Property to ramp colors between the non-interactive grouping symbols. The FlareClusterer.Gradient Property is set to a System.Windows.Media.LinearGradientBrush. The System.Windows.Media.LinearGradientBrush is made up of a System.Windows.Media.GradientStopCollection which is a container for System.Windows.Media.GradientStop objects. Each System.Windows.Media.GradientStop object has a .Color and .Offset Property which is used to define a specific color in the color ramp.
The System.Windows.Media.GradientStop with the smallest .Offset value becomes one end of the color ramp. The System.Windows.Media.GradientStop with the largest .Offset value becomes the other end of the color ramp. The .Color values are ramped along the color wheel continuum between the two .Offset values. Interim System.Windows.Media.GradientStop objects can be added in-between the two ends of colors and ramped along the color wheel continuum between the stops. See the following diagram:
Using MapTips with the FlareClusterer:
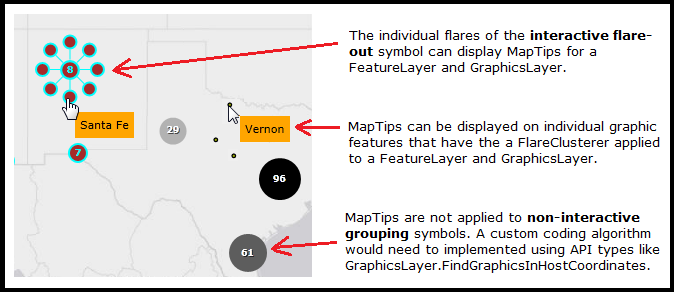
Because the FlareClusterer algorithm operates on the individual graphics in the FeatureLayer and GraphicsLayer, it is possible to set their .MapTip Property which will display in the interactive flare-out symbols of the FlareClusterer.
NOTE: Setting the .MapTip Property for the FeatureLayer or GraphicsLayer only impacts the individual graphic elements and the individual flares of the interactive flare-out symbol. Setting the .MapTip for the FeatureLayer or GraphicsLayer does not impact the non-interactive grouping symbol; meaning that the non-interactive grouping symbol will not display any MapTips. If providing some form of combined graphic attribute information for multiple graphics is desired for the non-interactive grouping symbol, you could use a creative solution like using the ESRI.ArcGIS.Client.GraphicsLayer.FindGraphicsInHostCoordinates in the Map Control to determine via a mouse click if the non-interactive grouping symbol was found and display a custom UIElement back to the user with the desired information.
FlareClusterer Limitations:
Unlike the Controls in the ESRI.ArcGIS.Client.Toolkit Assembly which have their source code provided as open-source by Esri on the CodePlex website, the FlareCluster Class is not open-source and your extensibility options are more limited. A custom template for the FlareClusterer Class has not been exposed for 3rd parties to customize its behavior. Therefore customizing the following behaviors are not possible unless you create your own FlareClusterer from the ground up: (1) change the speed of the rotation of the interactive flare-out symbol, (2) change the outline border or shape of the non-interactive grouping and interactive flare-out symbol to something else (ex: a dashed-outline square), (3) define the minimum and maximum size of the non-interactive grouping symbols, etc.
Example
How to use:
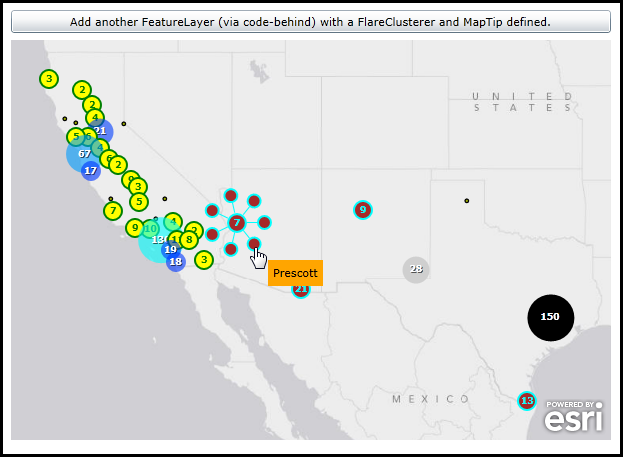
When the application loads a FeatureLayer with a FlareClusterer and MapTip will automatically be added to the Map (it was specified in XAML). Click the Button to add another FeatureLayer with a FlareClusterer and MapTip to the Map (it will be added via code-behind).
The XAML code in this example is used in conjunction with the code-behind (C# or VB.NET) to demonstrate the functionality.
The following screen shot corresponds to the code example in this page.
| XAML |  Copy Code Copy Code |
|---|---|
<Grid x:Name="LayoutRoot" > <!-- Add a Map Control to the application. Set the Extent the SouthWestern United States. --> <esri:Map x:Name="Map1" WrapAround="True" HorizontalAlignment="Left" VerticalAlignment="Top" Margin="0,150,0,0" Height="400" Width="600" Extent="-14050353,2763428,-10349676,5226797"> <!-- Add a backdrop ArcGISTiledMapServiceLayer. --> <esri:ArcGISTiledMapServiceLayer ID="World_Light_Gray_Base" Url="http://services.arcgisonline.com/ArcGIS/rest/services/Canvas/World_Light_Gray_Base/MapServer" /> <!-- Add a FeatureLayer. The Where clause is optional. It is necessary when more that 500/1000 records returned. In ArcGIS Server 9.3.1 and prior, the default maximum is 500 records returned per FeatureLayer. In ArcGIS Server 10 the default is 1000. This setting is configurable per map service using ArcCatalog or ArcGIS Server Manager (on the Parameters tab). Setting the IgnoreServiceScaleRange = "True" is helpful if the defined map service has restrictions on different scale levels for which the features can be viewed (ex: in the ArcGIS Services Directory REST documentation these would be the 'Min. Scale' and 'Max. Scale' metadata items). The value of "True" always draws the features regardless of the current map scale. --> <esri:FeatureLayer ID="CA_Cities" IgnoreServiceScaleRange="True" Where="STATE_NAME='California'" Url="http://sampleserver1.arcgisonline.com/ArcGIS/rest/services/Specialty/ESRI_StatesCitiesRivers_USA/MapServer/0"> <!-- Define a FeatureLayer.Clusterer that will help group clusters of cities together. --> <esri:FeatureLayer.Clusterer> <!-- Define the .FlareBackground and .FlareForeground for the animated 'interactive flare-out' symbols. The .MaximumFlareCount defines the maximum number of 'flares' that can be on a single animated 'interactive flare-out' symbol. The .Radius defines the maximum number of pixels that can be between individual graphic features in FeatureLayer before they convert to 'non-interactive grouping' or animated 'interactive flare-out' symbols. --> <esri:FlareClusterer FlareBackground="Yellow" FlareForeground="Green" MaximumFlareCount="15" Radius="5"> <!-- Use our own color scheme for the FlareCluster.Gradient. It ramps colors between the 'non-interactive grouping' symbols. --> <esri:FlareClusterer.Gradient> <LinearGradientBrush MappingMode="RelativeToBoundingBox" > <GradientStop Color="#990011FF" Offset="0"/> <GradientStop Color="#990055FF" Offset="0.25"/> <GradientStop Color="#990099FF" Offset="0.5"/> <GradientStop Color="#9900CCFF" Offset="0.75"/> <GradientStop Color="#9900FFFF" Offset="1"/> </LinearGradientBrush> </esri:FlareClusterer.Gradient> </esri:FlareClusterer> </esri:FeatureLayer.Clusterer> <!-- Add a MapTip to the FeatureLayer. 'CITY_NAME' is an attribute field in the FeatureLayer. --> <esri:FeatureLayer.MapTip> <Grid Background="LightYellow"> <TextBlock Text="{Binding Path=[CITY_NAME]}" FontWeight="Bold" Margin="5" /> <Border BorderBrush="Black" BorderThickness="1" CornerRadius="2" /> </Grid> </esri:FeatureLayer.MapTip> </esri:FeatureLayer> </esri:Map> <!-- Add a Button that will allow the user to add another FeatureLayer via code-behind. --> <Button Name="Button1" Height="23" HorizontalAlignment="Left" Margin="0,120,0,0" VerticalAlignment="Top" Width="600" Content="Add another FeatureLayer (via code-behind) with a FlareClusterer and MapTip defined." Click="Button1_Click" /> <!-- Provide the instructions on how to use the sample code. --> <TextBlock Height="114" HorizontalAlignment="Left" Name="TextBlock1" VerticalAlignment="Top" Width="600" TextWrapping="Wrap" Text="When the application loads a FeatureLayer with a FlareClusterer and MapTip will automatically be added to the Map (it was specified in XAML). Click the Button to add another FeatureLayer with a FlareClusterer and MapTip to the Map (it will be added via code-behind)." /> </Grid> | |
| C# | Copy Code |
|---|---|
private void Button1_Click(object sender, System.Windows.RoutedEventArgs e) { // Create an FeatureLayer. ESRI.ArcGIS.Client.FeatureLayer myFeatureLayer = new ESRI.ArcGIS.Client.FeatureLayer(); // Set the Url of the FeatureLayer to a public service. myFeatureLayer.Url = "http://sampleserver1.arcgisonline.com/ArcGIS/rest/services/Specialty/ESRI_StatesCitiesRivers_USA/MapServer/0"; // The Where clause is optional. It is necessary when more that 500/1000 records returned. In ArcGIS Server // 9.3.1 and prior, the default maximum is 500 records returned per FeatureLayer. In ArcGIS Server 10 the // default is 1000. This setting is configurable per map service using ArcCatalog or ArcGIS Server Manager // (on the Parameters tab). myFeatureLayer.Where = "STATE_NAME='Texas' OR STATE_NAME='New Mexico' OR STATE_NAME='Arizona'"; // Setting the IgnoreServiceScaleRange = True is helpful if the defined map service has restrictions on // different scale levels for which the features can be viewed (ex: in the ArcGIS Services Directory REST // documentation these would be the 'Min. Scale' and 'Max. Scale' metadata items). The value of // True always draws the features regardless of the current map scale. myFeatureLayer.IgnoreServiceScaleRange = true; // Set the ID of the FeatureLayer. myFeatureLayer.ID = "TX_NM_AZ_Cities"; // Create a new FlareCusterer. ESRI.ArcGIS.Client.FlareClusterer myFlareClusterer = new ESRI.ArcGIS.Client.FlareClusterer(); // FlareClusterer.MaximumFlareCount is the number of spinning outside circles that can appear on the clusterer // graphics. The default is 10. myFlareClusterer.MaximumFlareCount = 25; // The .Radius defines the maximum number of pixels that can be between individual graphic features in FeatureLayer // before they convert to 'non-interactive grouping' or animated 'interactive flare-out' symbols. The default is 20. myFlareClusterer.Radius = 35; // FlareClusterer.FlareBackground changes the solid color of the flare circle. The default is Red. myFlareClusterer.FlareBackground = new System.Windows.Media.SolidColorBrush(Colors.Brown); // FlareClucterer.FlareForeground changes the outline color of the flare circle and the text in the circle. // The default is White. myFlareClusterer.FlareForeground = new System.Windows.Media.SolidColorBrush(Colors.Cyan); // FlareCluster.Gradient: defines what the 'non-interactive grouped' symbol (without radial circle graphics) looks like as // the number of elements in the clustered graphic increases. System.Windows.Media.LinearGradientBrush myLinearGradientBrush = new System.Windows.Media.LinearGradientBrush(); myLinearGradientBrush.MappingMode = BrushMappingMode.RelativeToBoundingBox; // Create a collection to hold the GradientStops. Only two GradientStosp will be used for this demonstration. System.Windows.Media.GradientStopCollection myLinearGradientStopCollection = new System.Windows.Media.GradientStopCollection(); // The first GradientStop. System.Windows.Media.GradientStop myGradientStop1 = new System.Windows.Media.GradientStop(); myGradientStop1.Color = Colors.White; myGradientStop1.Offset = 0; // The second GradientStop. System.Windows.Media.GradientStop myGradientStop2 = new System.Windows.Media.GradientStop(); myGradientStop2.Color = Colors.Black; myGradientStop2.Offset = 1; // Add the GradientStops to the GradientStopCollection. myLinearGradientStopCollection.Add(myGradientStop1); myLinearGradientStopCollection.Add(myGradientStop2); // Set the LinearGradientStopCollection to the LinearGradientBrush.GradientStops Property. myLinearGradientBrush.GradientStops = myLinearGradientStopCollection; // Set the custom LinearGradientBrush setting to the FlareClusterer.Gradient Property. myFlareClusterer.Gradient = myLinearGradientBrush; // Finally set the FeatureLayer.Clusterer to our custom FlareClusterer. myFeatureLayer.Clusterer = myFlareClusterer; // Create a UIElement for displaying MapTips on the FeatureLayer. Grid myGrid = new Grid(); myGrid.Background = new System.Windows.Media.SolidColorBrush(Colors.Orange); TextBlock myTextBlock = new TextBlock(); myTextBlock.Margin = new Thickness(5); // Use Binding to display the 'CITY_NAME' Attribute field of the FeatureLayer into the TextBlock. System.Windows.Data.Binding myBinding = new System.Windows.Data.Binding("[CITY_NAME]"); myTextBlock.SetBinding(TextBlock.TextProperty, myBinding); myGrid.Children.Add(myTextBlock); // Set the FeatureLayer.MapTip to out custom MapTip. myFeatureLayer.MapTip = myGrid; // Add the FeatureLayer to the Map. Map1.Layers.Add(myFeatureLayer); } | |
| VB.NET | Copy Code |
|---|---|
Private Sub Button1_Click(sender As System.Object, e As System.Windows.RoutedEventArgs) ' Create an FeatureLayer. Dim myFeatureLayer As New ESRI.ArcGIS.Client.FeatureLayer ' Set the Url of the FeatureLayer to a public service. myFeatureLayer.Url = "http://sampleserver1.arcgisonline.com/ArcGIS/rest/services/Specialty/ESRI_StatesCitiesRivers_USA/MapServer/0" ' The Where clause is optional. It is necessary when more that 500/1000 records returned. In ArcGIS Server ' 9.3.1 and prior, the default maximum is 500 records returned per FeatureLayer. In ArcGIS Server 10 the ' default is 1000. This setting is configurable per map service using ArcCatalog or ArcGIS Server Manager ' (on the Parameters tab). myFeatureLayer.Where = "STATE_NAME='Texas' OR STATE_NAME='New Mexico' OR STATE_NAME='Arizona'" ' Setting the IgnoreServiceScaleRange = True is helpful if the defined map service has restrictions on ' different scale levels for which the features can be viewed (ex: in the ArcGIS Services Directory REST ' documentation these would be the 'Min. Scale' and 'Max. Scale' metadata items). The value of ' True always draws the features regardless of the current map scale. myFeatureLayer.IgnoreServiceScaleRange = True ' Set the ID of the FeatureLayer. myFeatureLayer.ID = "TX_NM_AZ_Cities" ' Create a new FlareCusterer. Dim myFlareClusterer As ESRI.ArcGIS.Client.FlareClusterer = New ESRI.ArcGIS.Client.FlareClusterer ' FlareClusterer.MaximumFlareCount is the number of spinning outside circles that can appear on the clusterer ' graphics. The default is 10. myFlareClusterer.MaximumFlareCount = 25 ' The .Radius defines the maximum number of pixels that can be between individual graphic features in FeatureLayer ' before they convert to 'non-interactive grouping' or animated 'interactive flare-out' symbols. The default is 20. myFlareClusterer.Radius = 35 ' FlareClusterer.FlareBackground changes the solid color of the flare circle. The default is Red. myFlareClusterer.FlareBackground = New System.Windows.Media.SolidColorBrush(Colors.Brown) ' FlareClucterer.FlareForeground changes the outline color of the flare circle and the text in the circle. ' The default is White. myFlareClusterer.FlareForeground = New System.Windows.Media.SolidColorBrush(Colors.Cyan) ' FlareCluster.Gradient: defines what the 'non-interactive grouped' symbol (without radial circle graphics) looks like as ' the number of elements in the clustered graphic increases. Dim myLinearGradientBrush As System.Windows.Media.LinearGradientBrush = New System.Windows.Media.LinearGradientBrush myLinearGradientBrush.MappingMode = BrushMappingMode.RelativeToBoundingBox ' Create a collection to hold the GradientStops. Only two GradientStosp will be used for this demonstration. Dim myLinearGradientStopCollection As System.Windows.Media.GradientStopCollection = New System.Windows.Media.GradientStopCollection ' The first GradientStop. Dim myGradientStop1 As System.Windows.Media.GradientStop = New System.Windows.Media.GradientStop myGradientStop1.Color = Colors.White myGradientStop1.Offset = 0 ' The second GradientStop. Dim myGradientStop2 As System.Windows.Media.GradientStop = New System.Windows.Media.GradientStop myGradientStop2.Color = Colors.Black myGradientStop2.Offset = 1 ' Add the GradientStops to the GradientStopCollection. myLinearGradientStopCollection.Add(myGradientStop1) myLinearGradientStopCollection.Add(myGradientStop2) ' Set the LinearGradientStopCollection to the LinearGradientBrush.GradientStops Property. myLinearGradientBrush.GradientStops = myLinearGradientStopCollection ' Set the custom LinearGradientBrush setting to the FlareClusterer.Gradient Property. myFlareClusterer.Gradient = myLinearGradientBrush ' Finally set the FeatureLayer.Clusterer to our custom FlareClusterer. myFeatureLayer.Clusterer = myFlareClusterer ' Create a UIElement for displaying MapTips on the FeatureLayer. Dim myGrid As Grid = New Grid myGrid.Background = New System.Windows.Media.SolidColorBrush(Colors.Orange) Dim myTextBlock As New TextBlock myTextBlock.Margin = New Thickness(5) ' Use Binding to display the 'CITY_NAME' Attribute field of the FeatureLayer into the TextBlock. Dim myBinding As System.Windows.Data.Binding = New System.Windows.Data.Binding("[CITY_NAME]") myTextBlock.SetBinding(TextBlock.TextProperty, myBinding) myGrid.Children.Add(myTextBlock) ' Set the FeatureLayer.MapTip to out custom MapTip. myFeatureLayer.MapTip = myGrid ' Add the FeatureLayer to the Map. Map1.Layers.Add(myFeatureLayer) End Sub | |
Inheritance Hierarchy
System.Object
System.Windows.Threading.DispatcherObject
System.Windows.DependencyObject
ESRI.ArcGIS.Client.Clusterer
ESRI.ArcGIS.Client.GraphicsClusterer
ESRI.ArcGIS.Client.FlareClusterer
Requirements
Target Platforms: Windows XP Professional, Windows Server 2003 family, Windows Vista, Windows Server 2008 family, Windows 7, Windows 8